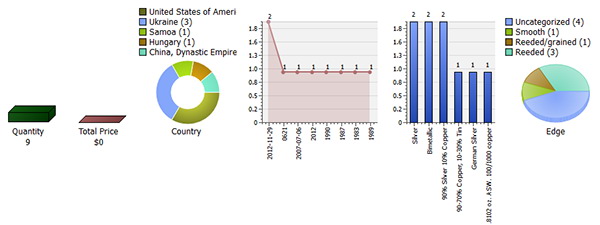
Using the statistic manager, customers can set up new statistics for collection (database).
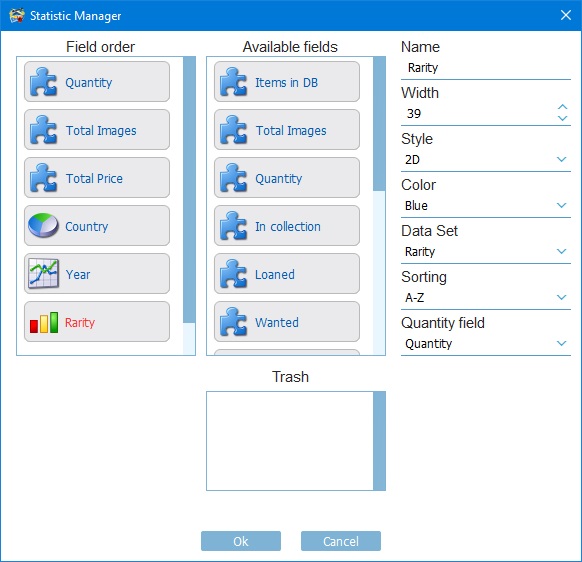
To open Statistic Manager, use submenu ‘Home’ -> ‘Statistic’ -> ‘Manager’
Field order list represents the order of the statistic widgets. Use drag & drop to change its order.
To delete one of the statistic widgets, drag and drop it to ‘Trash’. To add a new widget - move it from the list of ‘Available Fields’. Customers can choose colors, drawing styles, size and the names of fields. Results of editing are immediately displayed in the main window. Each type of statistic widget has own set of drawing styles and parameters.
Below are described all available statistic widgets.
Predefined widgetsParameters Name - Displayed title of widget. Width - Width dedicated for widget. Style - Drawing style: 2D or 3D, with or without horizontal lines. Color - Color or color gradient used to draw widget. Items in DB: Quantity of records in your database (not a quantity! this is a number of records) Total Images: Quantity of images in the database. Quantity: Total quantity of items. The quantity field is used to calculate items in your DB. In Collection, Loaned, Wanted: The quantity of items in collection/Loaned/Wanted. Fields Status and Quantity are used to calculate items in your DB. Total price, Sum. Valuation: Total price (summary valuation) of items in collection. Fields Status, Price (Valuation) and Quantity used to calculate items in your DB.
Custom Chart widgetsPie Chart: Is used to draw a pie chart. Parameters Name - Displayed title of widget. Width - Width dedicated for widget. Data Set - Choose one of the database fields to be used for chart calculation. For example: Country, Category, Material. Quantity field - Choose database field where the quantity for your chart is stored. This can be 'None', 'Quantity', 'Weight', etc. Style - One of the available styles: 2D, 3D, Toroid.
Bar Chart: Is used to draw a bar chart in the axis space. Name - Displayed title of widget. Width - Width dedicated for widget. Data Set - Choose one of the database fields to be used for chart calculation. For example: Country, Category, Material. Sorting - Sorting for Bar Chart. It can be sorted alphabetically (A-Z/Z-A) or by its value (Smaller to Larger 1-2-3, Larger to Smaller 3-2-1). Quantity field - Choose the database field where the quantity for your chart is stored. This can be 'None', 'Quantity', 'Weight', etc. Style - One of the available styles: 2D, 3D. Color - Color or color gradient used to draw widget.
Custom calculated widgetsSummation. This widget calculates the sum of the source field multiplied by quantity field. Name - Displayed title of widget. Width - Width dedicated for widget. Style - Drawing style: 2D or 3D, with or without horizontal lines. Source field - Choose one of the database fields to be used for calculation. For example: Quantity, Length, Price, Weight. Quantity field - Choose the database field where the quantity for your chart is stored. This can be 'None', 'Quantity', 'Weight', etc. Output format - How you want your resulting data to be displayed - as a number, currency or time. Example, let’s calculate the weight of gold in the coins collection. Source field = 'Gold weight', Quantity field = 'Quantity'.
Average. This widget calculates the average value of source field taking into account the quantity field. Name - Displayed title of widget. Width - Width dedicated for widget. Style - Drawing style: 2D or 3D, with or without horizontal lines. Source field - Choose one of the database fields to be used for calculation. For example: Length, Price, Weight. Quantity field - Choose the database field where the quantity for your chart is stored. This can be 'None', 'Quantity', 'Weight', etc. Output format - How you want your resulting data to be displayed - as a number, currency or time.
Formula. This widget calculates the sum of provided formula. Name - Displayed title of widget. Width - Width dedicated for widget. Output format - How you want your resulting data to be displayed - as a number, currency or time. Click on 'Edit' button in the Script value to open formula editor. Enter formula and click on 'Ok' to confirm. Read more about formulas in the 'Formulas' section of this manual.
Script. This widget runs customer-provided script to calculate statistic. Name - Displayed title of widget. Width - Width dedicated for widget. Style - Drawing style: 2D or 3D, with or without horizontal lines. Output format - How you want your resulting data to be displayed - as a number, currency or time. Scripting language - ECMAScript (Java Script). There are a lot JavaScript programming guides that can be found on the Web.
There are custom functions and variables used to communicate with the database: DB.getItemNumber(field,index) - Used to access item value (number).
Example: DB.getItemString(field,index) - Used to access item string value (string).
Example: DB.outRes(value) - Should be called at the of the script to send calculation result to the static widget.
Example of the script to calculate total price of used stamps:
To debug your script execution, enter your script in the script editor and click on ‘Run’. Result will be shown in the ‘Console out’ area. To prevent infinite loops, Multi Collector use fixed timeout near 30 seconds.
Video tutorial about Statistic view customization
|


